Increase? What Increase?
The Council claims, without any proof whatsoever, that there has been an increase of 44.5% in family households in the period 2001-11. Thereby, of course, they are implying big increases in the numbers of children.
The ABS Census statistics of children residing in the 2011 postcode area tell a very different story. These statistics show that have been declines in all age groups (0-4, 4-9-10-14) in the period between the 2001 Census and the latest Census in 2011 and there has been an overall decline of 34% on the 0-14 age group.
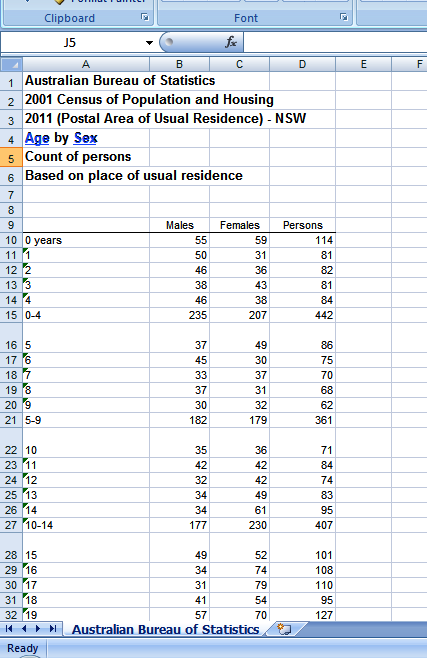
The image above is from a report downloaded from the Australian Bureau of Statistics website. It shows the 2001 Census figures for 2011 postcode.
This report shows that in the 2001 Census period there were:
442 childen in the 0-4 age group
361 children in the 5-9 age group
407 children in the 10-14 age group
that is: a total of 1,210 in the 0-14 age group.
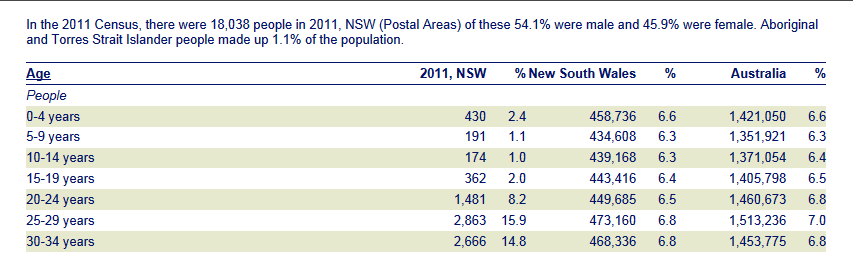
This image is from a report downloaded from the Australian Bureau of Statistics website. It shows the 2011 Census figures for 2011 postcode.
This report shows that in the 2011 Census period there were:
430 childen in the 0-4 age group
191 children in the 5-9 age group
174 children in the 10-14 age group
that is: a total of 795 in the 0-14 age group.
Conclusion:
Looking at each age group in turn, there has been in the period from 2001 to 2011 in the 2011 postcode area:
a decline from 442 to 430 in the 0-4 age group
a decline from 361 to 191 in the 5-9 age group
a decline from 407 to 174 in the 10-14 age group
a decline from 1,120 to 795 in the 0-14 age group.
Put in percentage terms, there has been a decline of 34% in the 0-14 age group between 2001 and 2011.